
For clarification, land surface temperature is an entirely different measurement than air temperature.
Fact Check
As parts of Pakistan and India saw life-threatening temperatures that broke recent records in spring 2022, a map depicting what appeared to be record-setting land surface temperatures was hot on social media.
The above tweet was by posted by the ADAM Platform account on April 29, 2022. ADAM stands for the Advanced geospatial Data Management (ADAM) tool that compiles global environmental data. It’s part of the European Open Science Cloud, an initiative to make scientific data publicly available. The ADAM account noted that the image above was collected by the Copernicus Sentinel 3 Land Surface Temperature (LST) device, a satellite operating under the European Space Agency that collects land surface temperature.
Widely circulated on social media, the LST map shared by the ADAM platform indeed painted a dire picture for residents living under oppressive temperatures in Southeast Asia. But some social media users unintentionally used the map out of context.
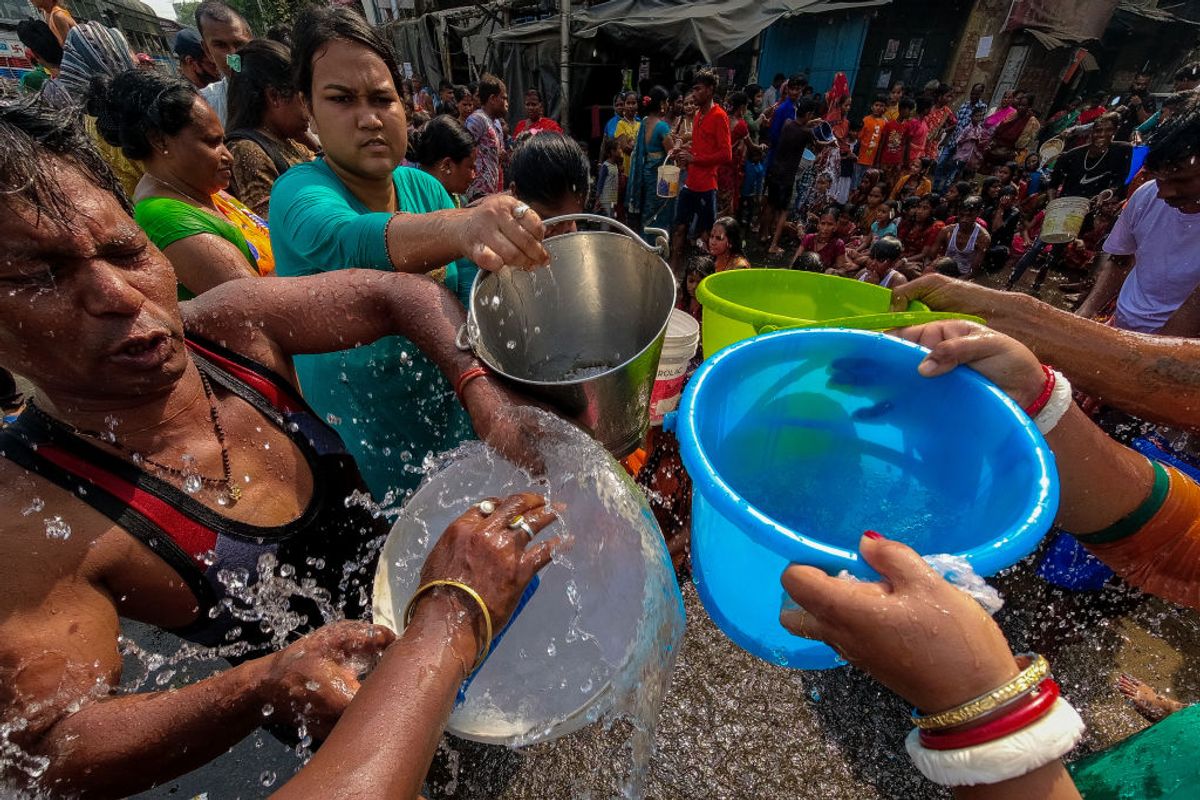
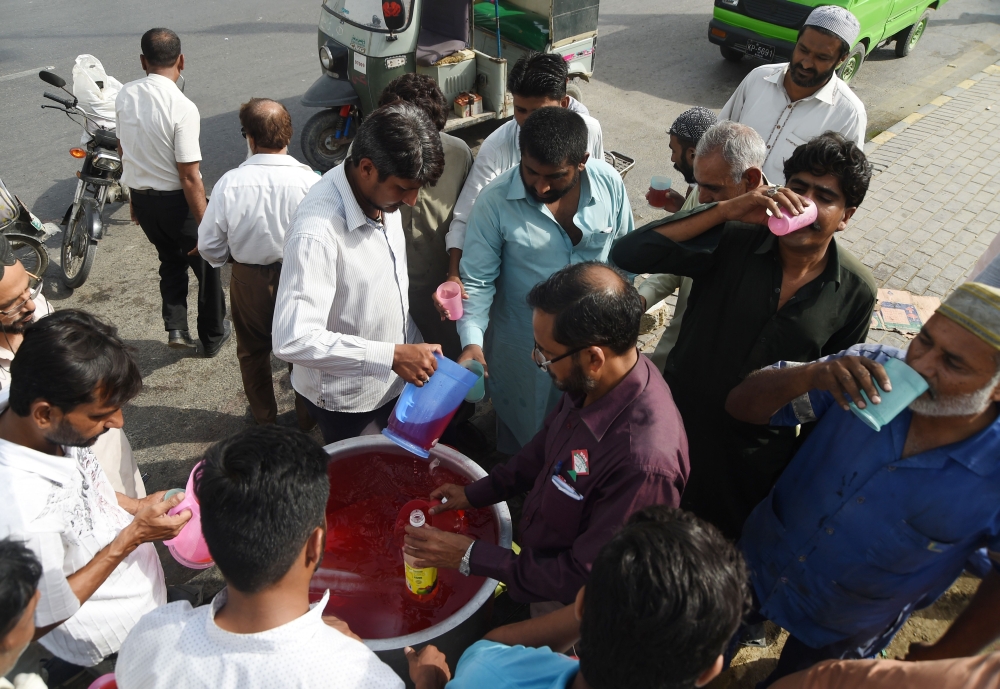
The post came as India and Pakistan saw an intense heatwave in early spring as temperatures in parts of the two countries reached record levels. Indian government officials stated that April was the third-hottest the country had seen since 1901, with an average maximum of 95.5 degrees Fahrenheit. Meanwhile, Pakistan was similarly plagued by warming temperatures in what could be an equally dire situation for both nations, where many lack access to air conditioning.
To understand how LST differs from air temperature, Snopes spoke with Cascade Tuholske, a postdoctoral research scientist at the Columbia Climate School, in a series of questions and answers:
How Is Land Surface Temperature Different From Air Temperature?
Tuholske (T): LST is the radiated heat from the ground, while air temperature is the air heat we experience as humans, sometimes called 2-meter air temperature. It is important to note that LST varies much more over short distances and short time frames than air temperature. We can think about this by touching the asphalt of a parking lot on a really hot day next to a baseball field. The asphalt to the touch is hot, whereas the grass on the field is much cooler. Yet the air temperature on our skin, which is likely somewhere between the temperature of the asphalt and the grass, does not change much as we move from the parking lot to the field. Thus, the LST of heat-absorbing surfaces on the ground, like asphalt, are very hot when we use a satellite to measure LST from space. But we don't live directly on top of the ground; we live 5 or 6 feet above the ground, and thus air temperature is much more important to understanding heat impacts to human health and well-being.
Another way to think about this is to turn on a stove. When we put our hand on the stove, we get burned. But when we move away, the heat of the stove dissipates. The stove will heat the air in a room, but that depends on how long we keep the stove on and how well the room is insulated.
What is Wet Bulb Temperature and How Does That Influence LST?
T: Wet bulb temperature (WBT) and wet bulb globe temperature (WBGT) are very specific metrics that account for humidity but in very different ways, and they should not be confused. Per this explanation, WBT is: "Wet bulb temperature is the lowest temperature to which air can be cooled by the evaporation of water into the air at a constant pressure."
WBT is a psychrometric is constructed from the air temperature (dry bulb), pressure, and water in a parcel of air.
WBGT is a metric that was created to estimate the combined impact of air temperature, humidity, radiated heat (e.g., land surface temperature), and wind on human physical output. It is measured with a field instrument and tied to several occupational heat health standards.
Both WBGT and WBT are two of many different metrics that try to assess how air temperature and humidity combined impact human health and well-being. In the U.S., a widely used metric that also does this is the Heat Index. Humidity is important to account for because at certain thresholds, with enough water in the air, we don't get any cooling benefit from sweating.
Both WBGT and WBT cannot be calculated from LST directly. Thus any attempt to use LST to estimate WBT or WBGT is not only inaccurate, it is highly misleading.
If the LST Captured in Images Were Combined with Wet Bulb Effect, Could Humans Without Air Conditioning "Boil to Death"?
T: Both WBGT and WBT cannot be calculated from LST directly. Thus, any attempt to use LST to estimate WBT or WBGT is not only inaccurate, but also highly misleading. This is not to say high LST values do not have impacts on human health and well-being. But it should not be used to measure direct impacts. In areas where we do not have good air temperature data, like much of India, LST is still a useful proxy for understanding impacts to human health and well-being. Further, LST is quite useful for looking at impacts on crops and plants, as it is tied to soil moisture and canopy temperatures. This is important for understanding how heat waves impact food production or wildfire likelihood.
What Makes WBT So Potentially Deadly?
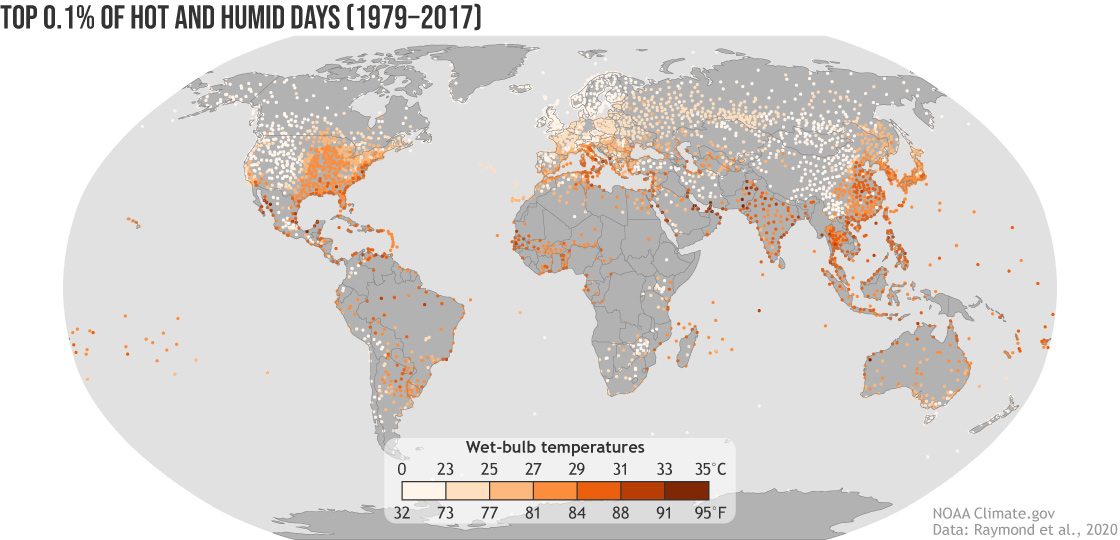
T: There are very clear limits in WBT that the human body can handle with even a few hours of exposure. Basically, when WBT hits between 32 and 35 degrees Celsius, humans do not get an evaporative cooling benefit from sweating. Even with any amount of water, we face high the likelihood of heat stroke, organ failure, and death at these upper WBT thresholds. These WBT thresholds have recently started to be crossed (and may be crossed more frequently going forward) in some of the most populated places on the planet. This means for those living and working in these locations, being outside may be deadly.
What Are the Thresholds for Heat-Related Fatalities?
T: Plants, humans, and animals are all impacted by heat differently. Humans, generally, can only tolerate WBT temperatures of between 30 and 35 degrees Celsius. I expect to see significant decreases in labor output in many of the most populated places on the planet where billions of people's livelihoods, both in cities and in rural areas, depend on working outside. I hope we adapt fast enough to prevent mass fatality events, though the heat wave in North America last year shows we need to raise awareness and prepare for extreme heat everywhere.
Is the Information Depicted in the Map Alarming?
T: The heat wave in Southern Asia is impacting the poorest and most vulnerable people on the planet right now. We have tools and the resources to move these people out of harm's way right now. We don't need new technologies per se. We need the political and cultural will to spend money to help vulnerable people. What is disturbing to me is that the rich and powerful worldwide do not care enough to create collective and coordinated action.
How Can Humanity Address Heat Issues?
T: We must rethink what we value as humans. Do we value the well-being of others, especially the poorest? I would say our current economic systems reflect that no, in fact, we do not value vulnerable people. If we shift resources to raise the floor so to speak, we will deploy tools we already have — like effective early-warning systems, cash transfers for those who can't work because of heat, infrastructure investments so electricity doesn't cut during heat waves and a/c units work, and so forth — and we can reduce the impacts of extreme heat.
We have the tools to adapt to extreme heat. We just have to use them. I am hopeful we will.
Sources
Clifford, Catherine. “India’s Record-Setting Heat Wave in Pictures.” CNBC, 2 May 2022, https://www.cnbc.com/2022/05/02/india-heat-wave-in-pictures.html.
CNN, Rhea Mogul, Esha Mitra, Manveena Suri and Sophia Saifi. “India and Pakistan Heatwave Is ‘Testing the Limits of Human Survivability.’” CNN, https://www.cnn.com/2022/05/02/asia/india-pakistan-heatwave-climate-intl-hnk/index.html. Accessed 3 May 2022.
Columbia Climate School. https://www.climate.columbia.edu/. Accessed 3 May 2022.
“Development of the weather and climate service ‘CRITERION’ for the touristic sector in e-SHAPE.” Ilmastokatsaus, vol. 4, no. 1, Feb. 2022. DOI.org (Crossref), https://doi.org/10.35614/ISSN-2341-6408-IK-2022-03-RL.
Freedman, Andrew. “India and Pakistan Heat Wave Sets Monthly Records, Triggers Fires and Power Outages.” Axios, 2 May 2022, https://www.axios.com/india-pakistan-heat-wave-climate-change-records-a59a1070-e367-43ba-aedc-296670267294.html.
“Home Page.” Adam Platform, https://adamplatform.eu/. Accessed 3 May 2022.
“Https://Twitter.Com/Leahmcelrath/Status/1520863600642039808.” Twitter, https://twitter.com/leahmcelrath/status/1520863600642039808. Accessed 3 May 2022.
“Https://Twitter.Com/Platformadam/Status/1519980107217129472.” Twitter, https://twitter.com/platformadam/status/1519980107217129472. Accessed 3 May 2022.
Mellen, Ruby, and William Neff. “Beyond Human Endurance.” Washington Post, https://www.washingtonpost.com/world/interactive/2021/climate-change-humidity/. Accessed 3 May 2022.
“Beyond Human Endurance.” Washington Post, https://www.washingtonpost.com/world/interactive/2021/climate-change-humidity/. Accessed 3 May 2022.
“Psychrometrics.” Wikipedia, 30 Apr. 2022. Wikipedia, https://en.wikipedia.org/w/index.php?title=Psychrometrics&oldid=1085398029.
Raymond, Colin, et al. “The Emergence of Heat and Humidity Too Severe for Human Tolerance.” Science Advances, vol. 6, no. 19, May 2020, p. eaaw1838. DOI.org (Crossref), https://doi.org/10.1126/sciadv.aaw1838.
“The Emergence of Heat and Humidity Too Severe for Human Tolerance.” Science Advances, vol. 6, no. 19, May 2020, p. eaaw1838. DOI.org (Crossref), https://doi.org/10.1126/sciadv.aaw1838.
Vecellio, Daniel J., et al. “Evaluating the 35C Wet-Bulb Temperature Adaptability Threshold for Young, Healthy Subjects (PSU HEAT Project).” Journal of Applied Physiology, vol. 132, no. 2, Feb. 2022, pp. 340–45. Penn State, https://doi.org/10.1152/japplphysiol.00738.2021.
Wet-Bulb Temperature - an Overview | ScienceDirect Topics. https://www.sciencedirect.com/topics/engineering/wet-bulb-temperature. Accessed 3 May 2022.