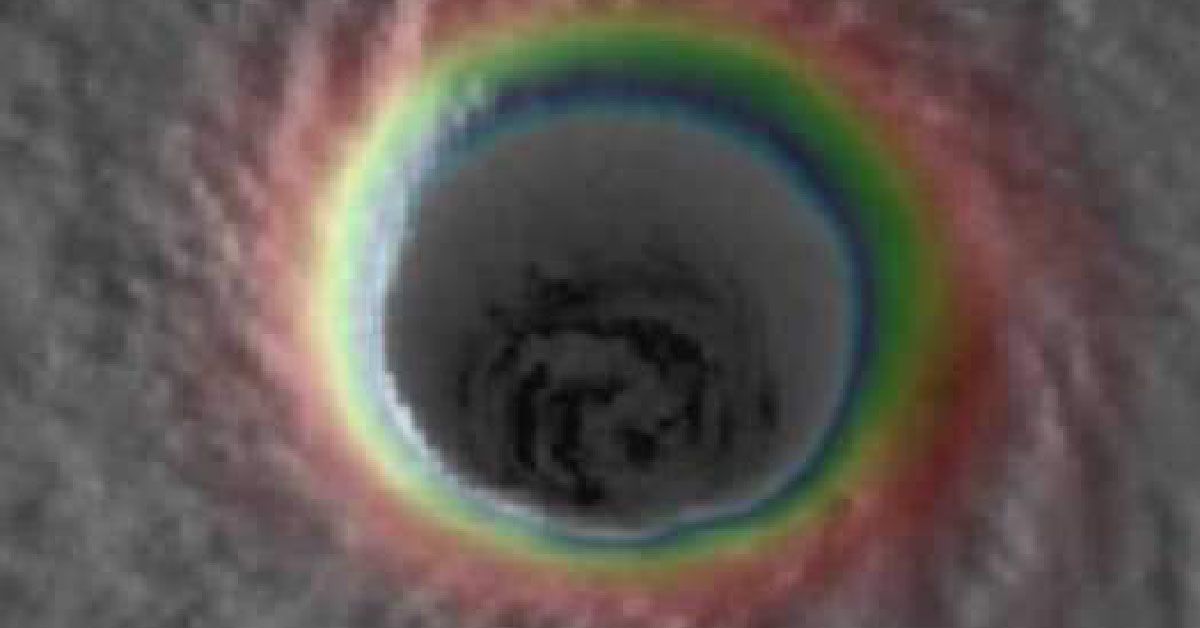

A satellite image shows the eye of Hurricane Dorian.
This image is a combination of infrared and visual imagery. In other words, this is not how Hurricane Dorian looks to the naked eye.
On Sept. 1, 2019, ABC Action News Chief Meteorologist Dennis Phillips posted an image on Twitter that supposedly showed the eye of Hurricane Dorian. Phillips credited the image to NASA and wrote that "this view of Hurricane Dorian is unlike anything I have ever seen":
Perhaps it was Phillips' superlative comment ("unlike anything I have ever seen") or the odd coloration of this image, but some viewers were uncertain of exactly what the image showed. Some questioned whether the image had been "photoshopped," while others, perhaps facetiously, retweeted the image as if showed a "rainbow hurricane" getting revenge on homophobes: "This is what happens when homophobic morons throw a parade for themselves. A rainbow hurricane."
This image has not been digitally altered. However, this is also not how the eye of Hurricane Dorian looked to the naked eye.
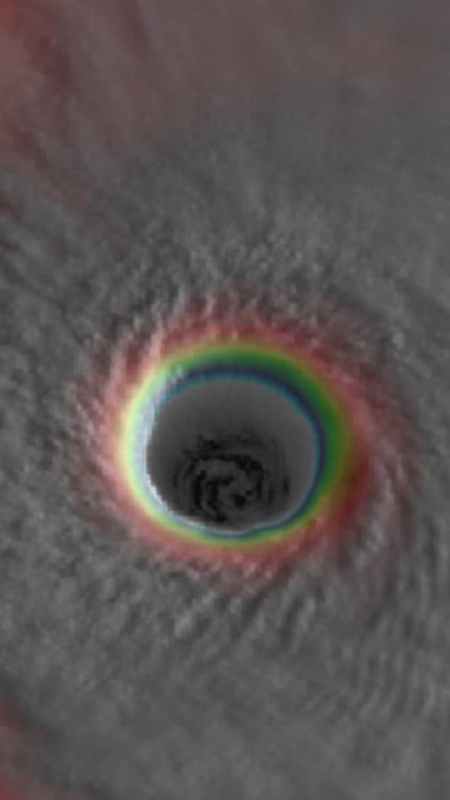
This photograph combines IR (infrared) and visual imagery from the GOES-16 satellite (Geostationary Operational Environmental Satellite) operated by NASA and the National Oceanic and Atmospheric Administration (NOAA). The viral image is actually a cropped version of a larger satellite photograph available via the website Severe Weather Europe:

We reached out to NOAA for more information about the viral image. Dan Lindsey, the GOES-R Program scientist at NOAA, told us:
That's a legitimate GOES-16 image of Hurricane Dorian. It's a visible/infrared "sandwich" image, where the color-enhanced infrared is put on top of a visible image. The colors here represent Infrared brightness temperature, and the lower the brightness temperature the colder and thus higher the cloud top, generally speaking. The colors don't correspond to wind speed. The image is from the morning hours of Sep. 1, but I don't know the exact time.
Infrared imagery provides scientists with a new level of information. These IR bands can be used by researchers to determine aspects of the storm such as cloud height, temperature, and water evaporation.
An article from NOAA explained some of the differences between visible and IR satellite imagery:
Infrared
In the infrared (IR) channel, the satellite senses energy as heat. The earth’s surface absorbs about half of the incoming solar energy. Clouds and the atmosphere absorb a much smaller amount. The earth’s surface, clouds, and the atmosphere then re-emit part of this absorbed solar energy as heat. The infrared channel senses this re-emitted radiation. A major advantage of the IR channel is that it can sense energy at night, so this imagery is available 24 hours a day. This is a disadvantage of the visible channel, which requires daylight and cannot "see" after dark.Visible Imagery
Visible satellite images, which look like black and white photographs, are derived from the satellite signals. Clouds usually appear white, while land and water surfaces appear in shades of gray or black.The visible channel senses reflected solar radiation. Clouds, the earth's atmosphere, and the earth's surface all absorb and reflect incoming solar radiation. Since visible imagery is produced by reflected sunlight (radiation), it is only available during daylight.
One of the major advantages of visible imagery is that it has a higher resolution (about 0.6 miles) than IR images (about 2.5 miles), so you can distinguish smaller features with VIS imagery.
Enhancements
IR images are often colorized to bring out details in cloud patterns. Depending on the type of enhancement, the colors are used to signify certain aspects of the data, such as cloud-top heights. This is important because taller clouds correlate with more active weather and can be used to assist in forecasting.
To sum up: The viral image of rainbow colors around the eye of Hurricane Dorian is a legitimate GOES-16 image of Hurricane Dorian. The colors are from an enhanced infrared image that were superimposed over a visible satellite image.