
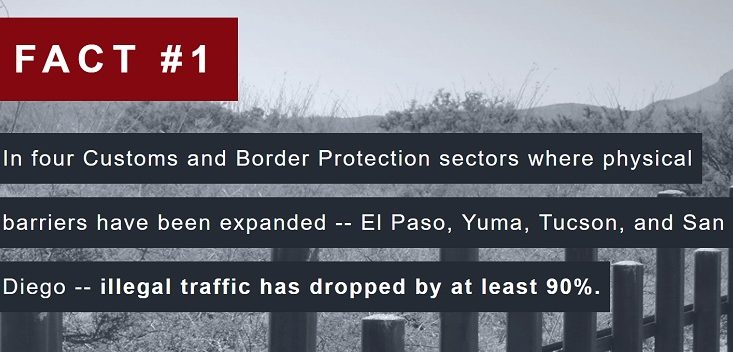
In the 8 January 2019 run-up to a primetime address by President Donald Trump on border security and the ongoing government shutdown over that issue, the Republican National Committee (RNC) released a set of seven facts on a page titled “borderfacts.com.” This article addresses the first claim on that page, which states (in full): "In four Customs and Border Protection sectors where physical barriers have been expanded -- El Paso, Yuma, Tucson, and San Diego -- illegal traffic has dropped by at least 90%."
The wording used in that claim was extremely vague. The RNC claimed that illegal traffic had dropped by 90% in four specific sectors which they described as locations “where physical barriers have been expanded,” implying (but not directly stating) that other sectors had seen no expansion of barriers. Thanks largely to the Secure Fence Act of 2006 and the DHS Appropriations Act of 2008, the mileage of physical barrier along the U.S. southern border with Mexico expanded from 119 miles to 654 miles between 2005 and 2015, according to the nonpartisan Government Accountability Office (GAO):
From fiscal years 2005 through 2015, CBP increased the total miles of primary border fencing on the southwest border from 119 miles to 654 miles -- including 354 miles of primary pedestrian fencing and 300 miles of primary vehicle fencing.
However, this increase in border fencing was not limited solely to the four CBP sectors that the RNC cherry-picked for this statistic. Both the El Centro sector and the Rio Grande Valley sector, the latter of which showed an increase in border apprehensions, also experienced an increase in fencing but were not included in the RNC “fact”.
The Department of Homeland Security (DHS) uses border apprehensions as a marker for attempted crossings, but the RNC did not specify which years they were comparing. The border apprehension figures provided by CBP from 2000-2017 and organized in this document show that every sector (with the exception of the fence-containing Rio Grande Valley) saw a decline in apprehensions.
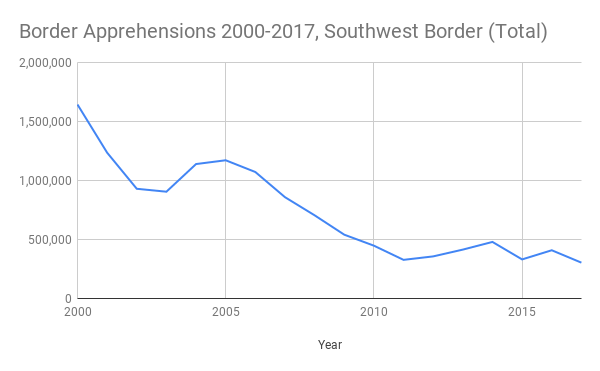
Below we have plotted the number of apprehensions at each sector from 2000-2017 in the sectors highlighted by the RNC, as well as the ones the RNC left out of their analysis:
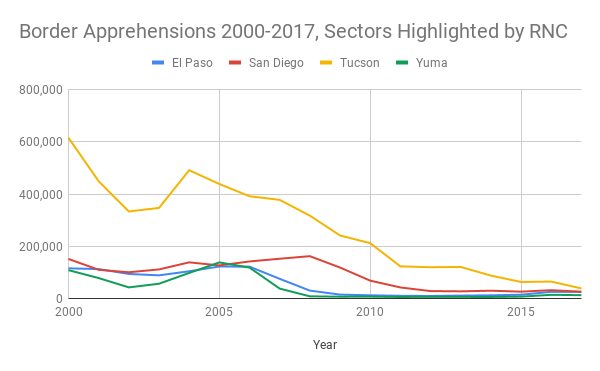
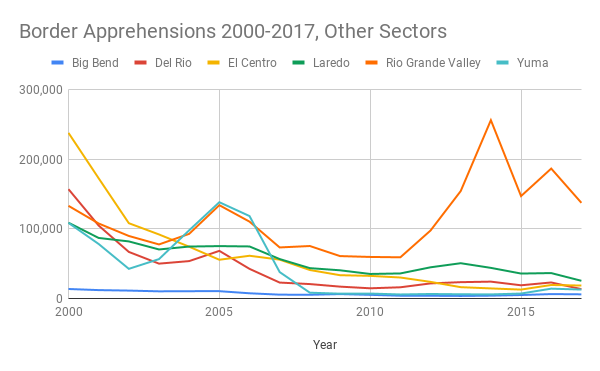
The overall trend along the southern border has broadly been one of declining apprehensions, regardless of fencing or barriers in various sectors. The only section that saw a net increase in border apprehensions over the 2000-2017 time period was the Rio Grande Valley, which was also the only sector “where physical barriers have been expanded” that the RNC conveniently omitted from their "fact". In total, border apprehensions across all sectors dropped 81% from 2000-2017:
All that said, the only way to demonstrate a 90+% decline in apprehensions in each of the sectors highlighted by the RNC is to play around with the years being compared. The only way the El Paso sector's decline in apprehensions can be made to top 90%, for example, is by comparing that sector's maximum and minimum values rather than the data from the first and final years of the timeframe (2000-2017) in question.
Since the RNC provided no “before” and “after” dates, they were technically free to pick and choose what years they wanted to compare. So to make their case for the El Paso sector, they could choose to compare 2005 to 2012, which yields a 92% reduction in border apprehensions for that sector. Similarly, only a few comparisons make the Yuma Sector top the 90% figure, so the RNC could have simply chosen to use the years 2005 and 2011, which yields a 96% reduction for that sector.
The Tucson section solidly shows a decline pretty much any way one looks at it, including over the entire 2000-2017 period, which yields a 94% reduction in apprehensions. The San Diego sector, on the other hand, requires going back even further than 2000 to make its apparent reduction in apprehensions top 90%. The highest value achievable within the 2000-2017 dataset comes from comparing 2008 to 2017, which produces an 84% reduction.
Because of the vaguely worded nature of this “fact,” one could make the argument that, since the San Diego sector was the first sector to experience any wall construction, it would still technically count as a sector “where physical barriers have been expanded” even if one used statistics going back all the way back to 1990, right before the first barrier was completed. That year saw roughly four times as many border apprehensions as year in the 2000-2017 dataset, and manipulating the numbers this way results in a 94% reduction in apprehensions in San Diego.
Overall, this “fact” is so vaguely worded that it can be technically true (though only by using inconsistent methods for evaluating each sector) while still being meaningless in terms of demonstrating a border wall’s efficacy. The overall trend during the past decade has been a significant decline in border apprehensions in nearly all sectors, including some that have had border barriers built/expanded, and some that have not.