
The seven biggest one-day point drops in Dow Jones history did take place during Republican presidencies.
Points drops are a skewed measure of stock market indices; Nine of the 10 biggest one-day percentage increases in history took place during Republican presidencies; stock market changes often happen regardless (or in spite) of the identity, party affiliation and policies of a given president.
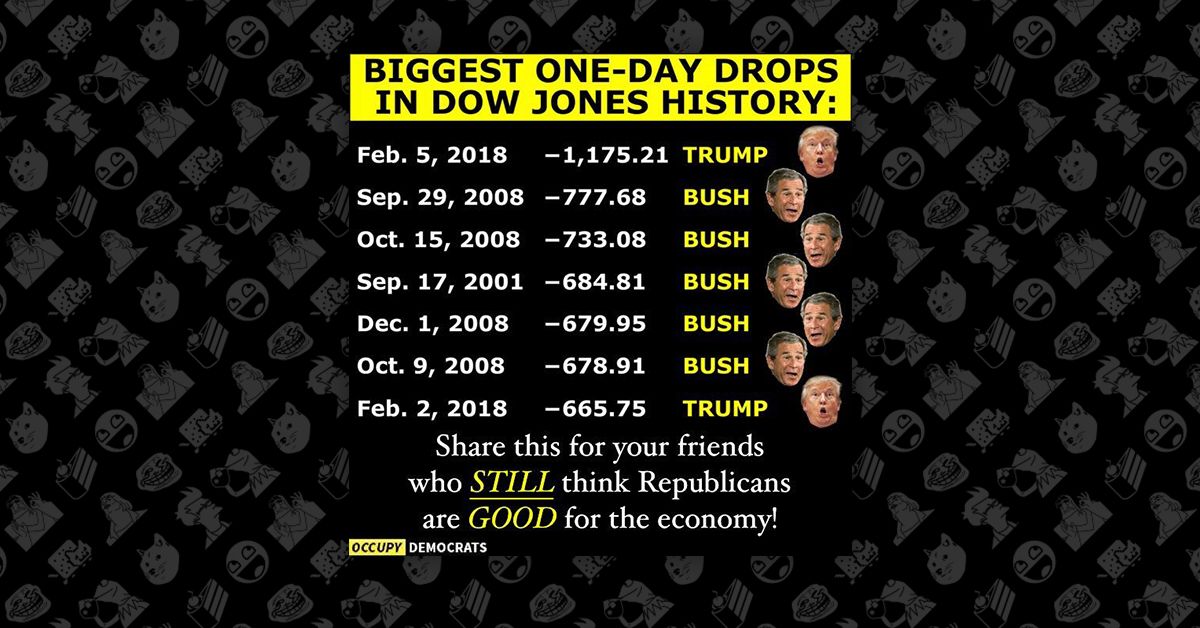
After the Dow Jones Industrial Average lost a historic 1,175 points in a single day in February 2018, the left-wing Facebook page Occupy Democrats was keen to point out a trend. In a 6 February meme, the page listed what it called the "Biggest One-Day Drops in Dow Jones History," along with the name of the U.S. president in office at the time of each point drop.
According to the meme, each of the largest drops occurred during the presidencies of Donald Trump and George W. Bush -- both Republicans. The meme concluded: "Share this for your friends who STILL think Republicans are GOOD for the economy!"
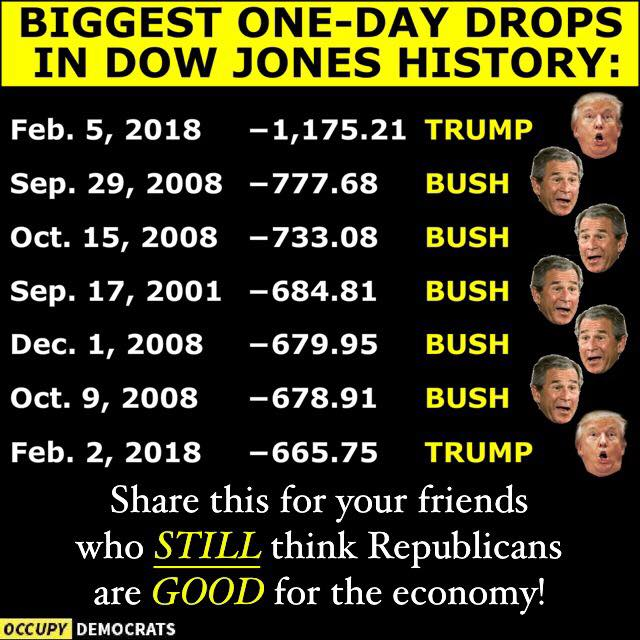
The meme correctly lists the seven biggest one-day points drops in Dow Jones history, which all took place during the tenure of two Republican presidents, though it leaves out the eighth, ninth and 10th, which occurred with Democrats Bill Clinton and Barack Obama in the White House.
The main problem with the meme, however, is that its conclusion (that the numbers show which president is good for the economy) overstates the influence of a president -- as opposed to macro-economic and geopolitical forces -- on stock market trends. In fact, one-day losses and gains can sometimes happen despite the policies and efforts of the person in the Oval Office. For example, many commentators attributed the 29 September 2008 points drop -- the second-biggest ever -- to the U.S. House of Representatives' failure to pass a $700 billion bank bailout bill, which President George W. Bush had pushed for.
Even if one simply wanted to examine during which presidencies the Dow suffered largest single-day losses, looking at the largest point drops wouldn't be the way to do it. As the stock market has grown in value over the last century, large point drops have become more common, even if their impact on the overall market value isn't particularly great. To get a clearer picture of the impact of these drops, one would have to measure the drop in percentage terms, rather than points.
Biggest one-day percentage losses
| Date | One-day percentage loss | President |
| 19 October 1987 | 22.61 percent | Ronald Reagan |
| 28 October 1929 | 12.82 percent | Herbert Hoover |
| 29 October 1929 | 11.73 percent | Herbert Hoover |
| 6 November 1929 | 9.92 percent | Herbert Hoover |
| 18 December 1899 | 8.72 percent | William McKinley |
| 12 August 1932 | 8.4 percent | Herbert Hoover |
| 14 March 1907 | 8.29 percent | Theodore Roosevelt |
| 26 October 1987 | 8.04 percent | Ronald Reagan |
| 15 October 2008 | 7.87 percent | George W. Bush |
| 21 July 1933 | 7.84 percent | Franklin D. Roosevelt |
(Sources: Wall Street Journal's Market Data and Yahoo! Finance's downloadable Dow Jones data)
Five of these 10 events took place during the era of the Great Depression, and all but one occurred during the tenure of Republican presidents.
However, if one were to insist on linking the occupant of the White House to the performance of the stock market, a better way to do it would be to track the average performance of the Dow Jones over the entire course of a presidency, rather than looking at one-day outliers in isolation.
To illustrate this, we looked at the average performance of the Dow over the course of the last nine presidential terms. We used Yahoo! Finance data for this, which only goes back as far as 29 January 1985, so we're missing figures for the first week or so of Ronald Reagan's second administration.
Average one-day percentage change in Dow Jones Average Industrial Index, Last Nine Terms
| Presidency | Dates | Average One-day Percentage Change |
| Donald Trump | 01/20/2017 - 02/06/2018 | + 0.09 percent |
| Barack Obama (Second) | 01/20/2013 - 01/19/2017 | + 0.04 percent |
| Barack Obama (First) | 01/20/2009 - 01/19/2013 | + 0.06 percent |
| George W. Bush (Second) | 01/20/2005 - 01/19/2009 | - 0.01 percent |
| George W. Bush (First) | 01/20/2001 - 01/19/2005 | + 0.01 percent |
| Bill Clinton (Second) | 01/20/1997 - 01/19/2001 | + 0.05 percent |
| Bill Clinton (First) | 01/20/1993 - 01/19/1997 | + 0.08 percent |
| George H.W. Bush | 01/20/1989 - 01/19/1993 | + 0.04 percent |
| Ronald Reagan (Second) | 01/29/1985 - 01/19/1989 | + 0.06 percent |
So while Donald Trump's presidency did see the largest one-day points drop in Dow Jones history, it has also seen the biggest average one-day percentage growth since 1985. However, this is based on only 12 months of data, and the next three years could see that 0.09 percent growth rate drop.
The biggest average daily percentage growth over the course of a four-year presidency was 0.08 percent, during Bill Clinton's first administration between 1993 and 1997.