
On 1 October 2017, pseudoscientific alternative health website NaturalNews.com, which is geared primarily toward supplement enthusiasts with a discerning taste for deep state conspiracy theories, posted an article ("Don’t Look Now, But Arctic Sea Ice Mass Has Grown Almost 40% Since 2012") that attempts to cast doubt on the scientific veracity of global warming by first presenting the following grotesque caricature of a straw man argument:
One of the most popular pieces of "evidence" that climate alarmists just love to bring up to prove the global warming narrative is the "all the ice is melting in the Arctic and the polar bears are dying" line. We’ve all seen the documentaries where a polar bear is desperately clinging to a tiny piece of ice and you just know he’s going to die soon.
They article then presents two observations that make the generally factual point that there has been relatively more sea ice in the Arctic and glacial ice on Greenland in 2017 than there have been at specific times in the recent past:
The latest figures from the National Snow and Ice Data Center, located at the University of Colorado, show that sea ice extent has increased by 40 percent since 2012. [...]
[The Danish Polar Portal reports that]: If we rank the annual surface mass balance since 1981 from low to high, the lowest on record was 2011-2012 (38 Gt) and this year is the 5th highest out of the 37 year record.
To be clear, the primary data scientists use to document global warming are records of Earth's temperature over time, not doomed polar bear imagery. Zeke Hausfather, a research scientist for the independent, nongovernmental Berkeley Earth research group told us in an e-mail that, in this area, pretty much "all groups who provide estimates" of global temperature unequivocally point to nearly uninterrupted temperature rises since the 1970s, as shown in this comparison of various estimates produced by the climate and energy policy website Carbon Brief:
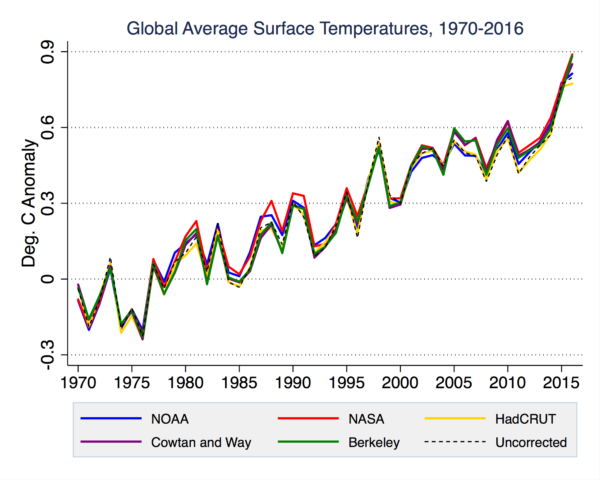
"People interested in global warming are best-served looking at actual global temperatures," Hausfather said.
While this temperature trend is uncontroversial and clear, the climate system as a whole is a complex beast with numerous entangled parts. The basic approach to writing a blog post that "debunks" the concept of global warming is to highlight without explanation various parts of that system at a single point in time. NaturalNews.com is no exception to that basic strategy here.
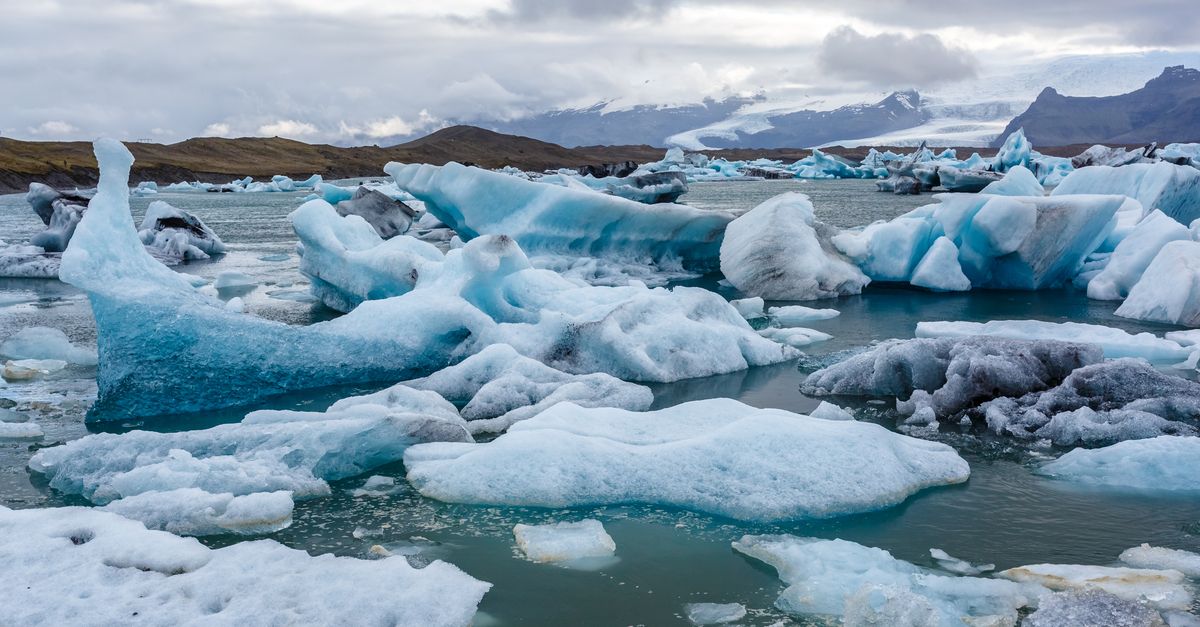
Arctic Sea Ice
Natural News cites a climate change denial blog called ClimateDepot.com as evidence of the claim that sea ice has grown 40 percent since 2012. In reality, the claim made by this website was more specific and less useful. In a post dated 18 September 2017, Climate Depot stated:
Arctic sea ice extent is up 40% from this date five years ago.
"Sea ice extent" is one of many different metrics used to characterize the presence of sea ice, and is generally defined as "the area of ocean [based on pixels in satellite imagery] where at least 15 percent of the surface is frozen". On the day of 17 September 2017, sea ice extent was indeed higher than it was on 17 September 2012:
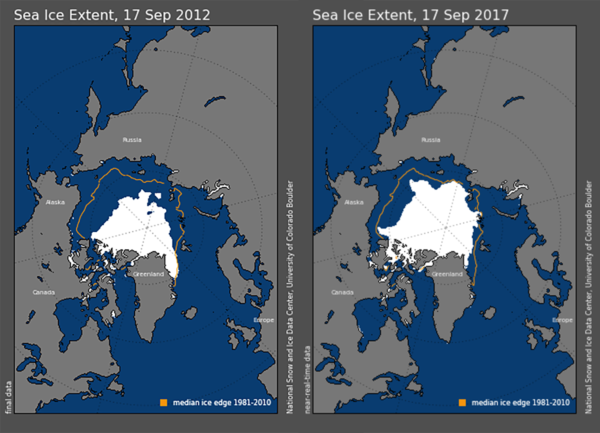
This does not mean, however, that sea ice has grown almost 40 percent since 2012, nor does it mean that the overall trend in arctic sea ice is toward growth — it hasn't and it isn't. The issue here is that sea ice extent is quite variable from year to year, and thus looking at two discrete points is a fairly useless exercise without the full context. "We don't expect it to monotonically decrease every year," Hausfather told us.
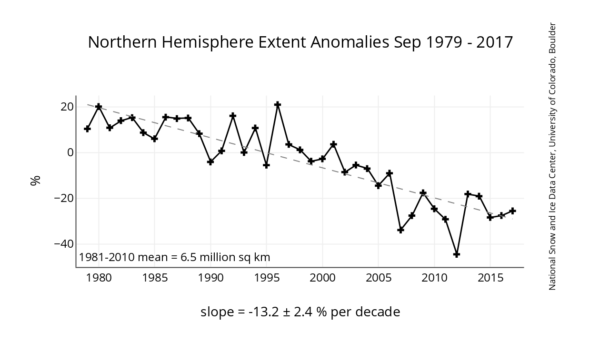
This chart (using data from the National Snow and Ice Data Center) shows September sea ice extent compared against the same average used in the maps cited by Climate Depot, showing both this aforementioned variability but also an overall trend of reduced ice extent. Note that the year 2012 was no random year to select for comparison; it is actually the record lowest year in terms of Arctic sea ice extent — making anything compared to it necessarily higher:
The overall trend of declining sea ice is even clearer when you look at a different measure: sea ice volume (presented by the Polar Science Center, below). Not only do such records show a clear negative trend, they also show just how anomalous 2012 was as a data point:

In reality, 2017 was the eighth lowest year on record for Arctic sea ice extent since satellite measurements began in 1978. But in no world but the pseudo-scientific fringe internet would the concept of global warming rely on every single year breaking the previous year's record for sea ice minimum.
Tom Karl, the former director of NOAA’s National Centers for Environmental Information, told us that 2017's sea ice extent was still much lower than the 1980-2010 average (by two standard deviations), and that, despite claims to the contrary, "one can't look at a trend over 5 years and say much about the impact of global warming as other factors are also important on these short time scales."
Glacial Ice on Greenland
The NaturalNews.com approach for glacial ice on Greenland was similarly lacking scale and context. The main source for these arguments was a completely legitimate end-of-year report put out by the Danish Polar Portal, a website run by the Danish Meteorological Institute. In that report, the organization makes this factual statement:
Heavy snow and rain in winter with a relatively short and intermittent summer melt season have left the Greenland ice sheet with more ice than has been usual over the last twenty years — in fact we have to go back to the 1980s and 90s to see a year similar to this one in terms of snow fall and ice melt.
This statement, and the figures presented by NaturalNews.com, are referring to a metric known as Surface Mass Balance (SMB), which Polar Portal describes:
Each year glaciers gain ice from snow and freezing rain and lose ice by melt that runs off. Adding these together gives the surface mass budget (SMB) in Greenland, the ice sheet typically gains mass from around September to May and loses more mass than it gains in the ablation [melting] season of June, July and August.
Importantly, however, this measurement only presents half the picture in terms of how much mass is being lost from year to year from Greenland's glaciers. That's because it does not include the rather significant portion of ice that breaks — or calves — off into the ocean to melt elsewhere. On average this accounts for about 500 Gt [gigatons] of further ice loss. This, as stated in the Polar Portal post, nearly matches the estimated gain in SMB reported by Natural News, effectively canceling it out.
In a post on Carbon Brief, analysts with the Danish Meteorological Society put this year’s measurement in context:
While the Greenland ice sheet has seen a neutral, or small positive, change in ice for this year, it should be noted that Greenland has lost approximately 3,600bn tonnes of ice since 2002.
Like the record of Arctic sea ice earlier, when put in the context of the entire trend of Greenland's ice mass over time (presented by Polar Portal below), 2017's measurement does nothing to change larger and completely unambiguous trends of overall melting:

Further, in the case of Greenland's ice sheet, there is not much of a mystery surrounding the lackluster amount of melting this year; a massive storm — the remnants of Hurricane Nicole — parked itself atop the continent, dumping a large amount of snow on the ice-covered continent:
Heavy rain and snow in October in especially eastern Greenland gave record totals of precipitation in the main east coast town of Tasiilaq as the remnants of former hurricane Nicole passed by and, much as with Harvey in Houston this year, got lodged over eastern Greenland for some days. However, after Nicole’s extreme precipitation, the rest of the winter was actually pretty average in terms of the amount of snow that fell.
Because neither the higher-than-2012 arctic sea ice from 17 September 2017 nor the neutral amount of ice loss in Greenland in 2017 do anything to disrupt the overall trends of decreasing ice, and because climatological science does not require (nor does it expect) ice or temperature records to be broken every single year, we rank the claim that these observations are reasons to doubt the tenets of climate change as false.