

Debt is typically a major campaign issue in elections from the municipal level all the way up to the office of the President of the United States. Candidates tout their accomplishments in balancing budgets or reducing government debt as examples of fiscal prudence while pointing to increased debts during their opponents' administrations as indicators of profligate and wasteful spending of taxpayers' money.
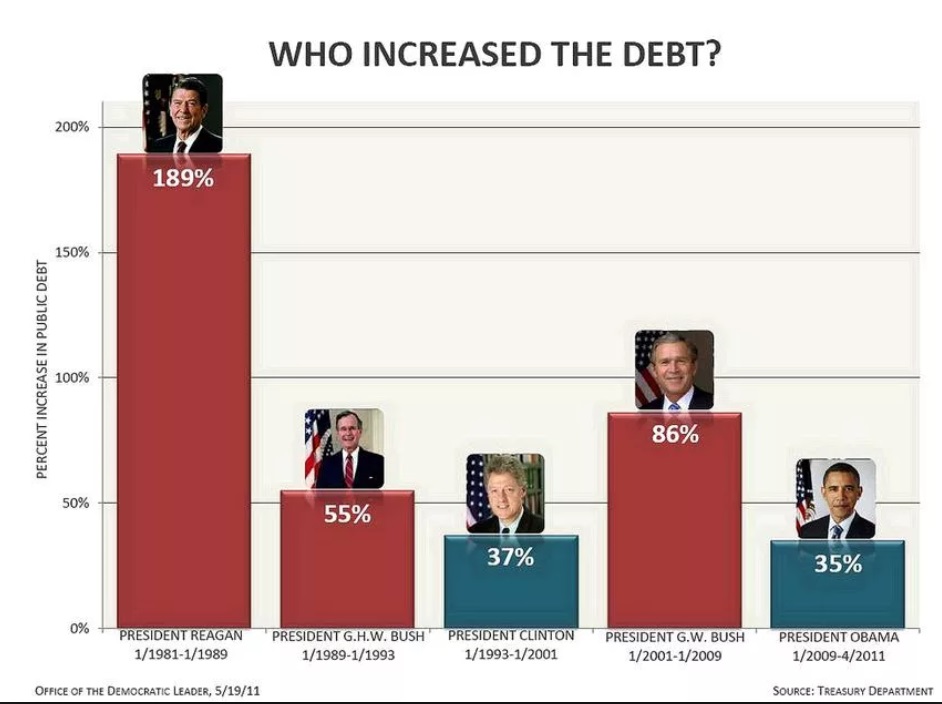
The chart reproduced above, which was posted to the Flickr account of House Minority Leader Nancy Pelosi, attempted to reverse conventional political stereotypes by portraying recent Republican presidents as responsible for huge increases in the national debt, while showing recent Democratic presidents as responsible for much lower increases in the level of debt.
As a first step in evaluating this chart, we have to determine the applicable definition of "debt." In general, the term "public debt" (or "debt held by the public") refers to money borrowed by the government through the issuance and sale of securities, government bonds, and bills. It includes federal debt held by all investors outside of the federal government, including individuals, corporations, state or local governments, the Federal Reserve banking system, and foreign governments. Another form of debt is "intragovernmental debt" (or "debt held by government accounts"), which refers to money that the government has borrowed from itself, such as when the U.S. government invests money from federal savings programs such as Medicare and the Social Security trust fund by buying up its own treasury securities. A variety of names have been applied to the total of these two forms of debt, including "gross federal debt," "total public debt," and "national debt."
Although this chart is labeled as presenting a "percent increase in public debt," it actually uses figures corresponding to the total described as "gross federal debt" above (i.e., a combination of debt held by the public and debt held by government accounts, rather than just the former). We checked the numbers in this chart by using (for pre-1993 years) the U.S. Treasury's Monthly Statement of the Public Debt (MSPD), noting the total debt reported as of
From these records, we gleaned the following information:
Ronald Reagan:
Took office January 1981. Total debt: $848 billion
Left office January 1989. Total debt: $2,698 billion
Percent change in total debt: +218%
George H.W. Bush:
Took office January 1989. Total debt: $2,698 billion
Left office 20 January 1993. Total debt: $4,188 billion
Percent change in total debt: +55%
Bill Clinton:
Took office 20 January 1993. Total debt: $4,188 billion
Left office 20 January 2001. Total debt: $5,728 billion
Percent change in total debt: +37%
George W. Bush:
Took office 20 January 2001. Total debt: $5,728 billion
Left office 20 January 2009. Total debt: $10,627 billion
Percent change in total debt: +86%
Barack Obama:
Took office 20 January 2009. Total debt: $10,627 billion
Total debt (as of the end of April 2011): $14,288 billion
Percent change in total debt: +34%
So, as far as raw numbers go, the chart is reasonably accurate (although our calculations produced a somewhat higher debt increase for Ronald Reagan than reported). That said, however, we have to consider how valuable these numbers are; whether by themselves they present a reasonable comparative measure of presidential fiscal responsibility. In that regard, one could find a number of aspects to take issue with:
- The chart isn't a true comparison of equals, as it includes three presidents who served two full terms (Reagan, Clinton, and George W. Bush), a president who served one term
(George H.W. Bush), and a president who had served half a term (Obama). Obviously, the longer a president holds office the greater the opportunity for him to influence the debt, and certainly (barring a radical change in current circumstances) the increase reported for Barack Obama would be considerably higher by the time he left office. - All presidents come into office with policies and budgets that were put into place by their predecessors in the White House and Congress, and they all pass the same along to their successors when they leave office. Therefore, determining how much of the change in debt that occurs during a given president's administration is actually the result of his actions (rather than the consequence of factors over which he had little or no influence) would require a much more complex analysis than the one presented here.
- Which is the best measure of debt for this purpose: public debt, intragovernmental debt, or a combination of the two? As noted in the General Accounting Office's FAQ on Federal Debt, they represent rather different concepts:
Debt held by the public approximates current federal demand on credit markets. It represents a burden on today's economy, and the interest paid on this debt represents a burden on current taxpayers. Federal borrowing from the public absorbs resources available for private investment and may put upward pressure on interest rates. Further, debt held by the public is the accumulation of what the federal government borrowed in the past and is reported as a liability on the balance sheet of the government's consolidated financial statements.
In contrast, debt held by government accounts (intragovernmental debt) and the interest on it represent a claim on future resources. This debt performs largely an internal accounting function. Special federal securities credited to government accounts (primarily trust funds) represent the cumulative surpluses of these accounts that have been lent to the general fund. These transactions net out on the government's consolidated financial statements. Debt issued to government accounts does not affect today's economy and does not currently compete with the private sector for available funds in the credit market.
- Are plain percentage changes in the national debt level a useful figure, or do they need to be placed in context to have relevance? Some would argue, for example, that the Debt-to-GDP ratio is a better measure of economic health relative to the national debt than raw debt figures alone, and a chart which tracked the change in that ratio over the last several presidencies would paint a significantly different picture of debt levels than the one displayed above.
All in all, this is a case of relatively accurate information which is of marginal value due to a lack of proper comparative context.